Monday, July 30, 2007

ABS data set construction update

Today I met up with Gary to commence our collective construction of the ABS data set from catalogs 5204.0 and 5206.0. The panel data set is going to be constructed along:
  • Time (in years)
  • Industry
  • Input variables such as capital stock, capital service, capital expenditure
Initially we were faced with a few problems in trying to work out what items we were going to include since numerous studies have elaborated on the various production inputs in different levels of detail. We have decided on including the following variables:
  • Capital stock - for IT and Non-IT
  • Capital service - for IT and Non-IT
  • Labour productivity
  • Labour hours
  • Cost of employment
  • Gross Value Added
  • Hardware, Software (IT) expenditure and non-IT expenditure
We also faced problems in trying to match up these required variables with the data that the ABS has provided in these two catalogs. The fundamental difference between the two catalogs is that 5206.0 deals with data that is reported quaterly whilst 5204.0 deals with data that is reported in annually. Since the panel data set is going to need annual data we will be predominantly be using the items retrieved from 5204.0. Additionally we were slightly confused with what items in 5204.0 match up to our items especially regarding capital. However after consulting with Dr. Poon today this has been clarified. Additionally Dr. Poon has provided us with a data set up to the year 2002. This data set will not only provide us further guidance in constructing the data set but also serve as a means to use as a "test" data set, which I can use to test my AES function which i will write in R in the coming weeks.

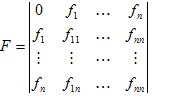
Dr. Poon also provided us with further insight into our thesis in our brief consultation. Dr.Poon brought to my attention that I might need to obtain data on rental prices and include this in my model and calculation of AES. However I will first need to review my literature to see if previous work has included this. If they have not then the partial derivatives in the Hessian matrix (see post Test for Substitution Elasticity) will be:

  • the co-efficients from the regression * [value add (output) / input of the variable]

I will continue to work on panel data set construction with my fellow peers and hope to have it almost complete by the end of the week.

Sunday, July 29, 2007

Project Plan

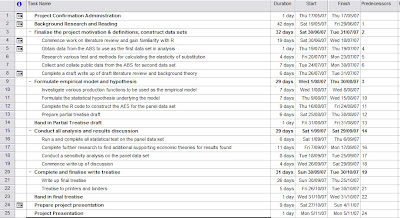
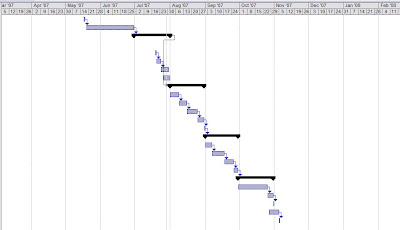
On Thursday the 26th of July i handed in my project plan for assessment. As mentioned in my previous posts I was going to post up a copy of my plan and a Gant chart. Click on the thumbnails to view the specific details of the project plan and Gant chart.

Project Plan
GANT Chart


Tomorrow I will be meeting with two of Dr. Poon's other treatise students Gary and Nik to collate the data set that I had mentioned in my previous posts. We have all read how the data construction was done in the Parham (2001) paper and it appears to be quite straight forward. In addition to continuing the write up of my literature review and reviewing further papers, I have also spent a significant amount of time become more and more familiar with R. I am also looking into how to write functions in R as I will need to write a function using R code to implement the AES. Over the next coming days I will write more in depth about how I will go about implement AES in R and reviewing some further papers which I have found to be quite interesting.

Tuesday, July 24, 2007

Thesis Meeting Overview: July 23rd 2007

On Monday the 23rd of July my thesis weekly resumed with Dr. Poon and his other supervised engineering thesis students. The purpose of this meeting was to provide each other a brief overview of what we have found in our research areas. My overview was based on informing Dr.Poon, Gary and Nik about the different means where elasticity of substitution can be measured. The details of my presentation can be found in my previous posts. This was a very interesting as I became more aware of Nik's and Gary's topics. Gary gave a very interesting presentation about Fuzzy clustering and different algorithms which implement fuzzy clustering such as c-means and clustering regression. Nik gave an overview about General Additive Models (GAM).

My thesis meeting also clarified the steps we will take in finding a suitable data set for my model since our plans to obtain a particular subset of the data collected from the ABS economic activity survey fell through. Simon has proposed that as a data gathering and skills building exercise, Nik, Gary and myself to construct a data from the publicly available data from the ABS. The data to be collected is from the following catalogs:
  • 5204.0 – Australian System of National Accounts
  • 5206.0 – Australian National Accounts
Our task is it replicate the data collection and construction technique from the following paper:
  • Parham, D., Roberts, P. & Sun, H.,'Information Technology and Australia's Productivity Surge', 2007.
The items that we will be extracting from catalogs 5204.0 and 5206.0 include items such as:
  • Industry Value Add (output)
  • Cost of Employment
  • Industry Machinery
It has been agreed that we will each overview these catalogs and gain familiarity with the data construction techniques, We will then get together to aggregate our data into a single data set and will also chase up the ABS about acquiring any missing data. Additionally I am also responsible for finding and appropriate deflator for our data set. Since we have observations across time it is important to account for inflation and express the units in constant dollar terms across the time range.

Once we have aggregated and formed our data set we will each use this data set in our respective projects where hopefully we can find interesting results which we can use to assist the other in their project.
Our next meeting is to be held Wednesday next week. I am also required to provide another brief presentation as to how I am going to go about measuring and estimating AES for the panel data set.

The meeting deliverables are:
  • Construct the ABS data set
  • Provide and overview to my fellow peers on how I will go about implementing AES using R and other tools

Monday, July 23, 2007

Test for Substitution Elasticity

The following is a brief overview of the presentation that I will be giving in my thesis meeting today.

What is Partial Elasticity?

Partial Elasticity of Substitution is the proportional change in the ratio of the use of two inputs brought about by a change in the relative price ratio for these two inputs. Since my thesis topic is concerned with a production function with multiple input factors we must use a measure that considers the multi-factor case. The main measures that I have come across my research are the Allen Partial Elasticity of Substitution (AES) and Morishima elasticity of substitution (MES).

What is AES?

AES is defined as the percentage change in the ratio of the quantity of two factors to the percentage change in their price ration allowing all other factors to adjust to their optimal level (Hitt 2005). AES tends to be usually measured via cost functions but a lot the research I have undertaken has used various production functions to measure it. As noted by Chambers (1988) AES is defined by:

Where: xi xj, are the inputs we wish to see if they are complements or substitutes
fi is the first order partial derivative of our production function with respect to xi .
F is the bordered Hessian Matrix:

Fij is the cofactor associated with fji
If σij > 0 than the two inputs are substitutes if σij >0 then the are complements

What is MES?

MES measure the relative input changes as opposed to AES which measures the absolute input changes. MES can be re-expressed in terms of AES.


Where: σijA and σ jjA are Allen elasticities of substitution.

It should be noted that unlike AES which is symmetrical MES is asymmetric. Furthermore if inputs are classified as substitutes under Allen’s measure they are substitutes under Morishima’s measure. However if the inputs are classified as complements under Allen’s measure they are not necessarily compliments under Morishima’s measure. Hence it is important to note that MES has a bias towards treating the inputs as substitutes and AES is biased towards treating them as compliments.

Production Functions Used

Reviewing the literature I have found various production functions have been used in testing the elasticity of substitution for the various factor inputs. They are:

  • Cobb Douglas Production Function
  • Translog Production Function
  • CES- Translog Production Function

The majority of the literature do not use the Cobb Douglas production function when estimate the Allen partial elasticity of substitution since its function constrains the substitution elasticities to be unity (Dewan et al. 1997). Consequently the Translog and CES-Translog production function tend be more readily used.

Statistical Tests

Since the substitution elasticities calculated are highly non-linear in their parameters the means and standard errors are approximated via various techniques these are:

  • Bootstrapping
  • Monte Carlo Simulation
  • Dividing the sample into different sub-sample and then estimating the separate production functions for each sample.

For the first two methods standard one tailed statistical test apply. However if the latter method is applied then the distributions of substitution of elasticities for each sub-sample are then compared using distribution fee statistical tests which are:

  • Median Test
  • Wilcoxon Rank Test.

After my meeting I will write more in depth of any additional deliverables.

Saturday, July 21, 2007

Update on the ABS Data request

The ABS got in contact with me on Thursday. Unfortunately the news was not the best. The consultant had informed me that the data I was requesting from the Economic and Activity Survey would not be available for purchase. This is because items such as Computer Software Expensed are not collected annually but every four years. As a result the data is not of a quality that can be used to do statistical analysis upon. The consultant did point me however to two surveys that could be of use. They are:
  • 8126.0 - Information and Communication Technology, Australia, 2004-05, for items related to IT and communications.
  • 8155.0 - Australian Industry, 2004-05, for items such as operating income etc.
The data for these items are available for previous and may prove useful for my thesis. I have contacted Dr. Poon about this matter and he has informed me that we will discuss this in our next Meeting on Monday the 23rd of July. Hopefully this problem in obtaining the data that Dr. Poon would have liked me to obtain will not pose a big problem in the continuing progress of my thesis.

Wednesday, July 18, 2007

ABS data gathering and update on progress

Since my last post I have been reviewing the papers i have found and have started to write my literature review. As mentioned in my previous post we have collectively decided with Dr. Poon that we will aim to have this finished by the end of the month. Reviewing my progress so far, I am definitely on track to meet this milestones deadline and may even be able to start the model building earlier than i anticipated.

I also contacted the ABS today with regards to obtaining a quote for the data from the Economic and Activity Survey. The individual which i spoke with was very helpful and within 24 hours an information consultant will contact me to inform me not only how much the data will cost but also the level of detail of the data. I will be writing more about this shortly in my next post.I have also started my detailed engineering plan which is due Friday the 27th of July. Once i have a fairly complete project plan I will post up a screen shot of the GANT chart.

Over the next coming days I will continue to work on my literature review and my presentation next week to my fellow peers where I will be presenting the different techniques where elasticity of substitution and complementarities can be measured.

Wednesday, July 11, 2007

Thesis Meeting: July the 9th 2007

On Monday a meeting was held with Dr. Poon and my fellow colleagues to discuss our progress in research what the deliverables will be for the next few week. We all gave updates on where we were in terms of our research and Dr. Poon was please with our progress.

One of my tasks will be to obtain data from the Australian Bureau of Statistics (ABS) that will be used in my model to estimate the complementarities between hardware and software. The data to be obtained will be from the Economic Activity Survey, from 1998 to 2007. Whilst a lot of the literature I have found does advocate the use of firm level data, Dr. Poon has advised me that the ABS most likely will not provide this level of detail. He has suggests that I ask the ABS for data broken up by firm size i.e. small, medium and large. Whilst this level of detail is not the most desirable form it will still serve the purpose of treatise well in examining the complementarities between hardware and software. The items from the survey which I am required to obtain data for are:

  • Employment
  • Income from Services
  • Sale of Goods
  • Total Income
  • Labour Costs
  • Purchases
  • Telecommunication Services
  • Computer Software Expensed
  • Training Services provided by other businesses
  • Other Management and Administrative services
  • Reported operating profit or loss before tax
  • Inventories
  • Derived items
  • Capital expenditure and disposal of assets including computer software capitalised and computers and computer peripherals
  • Capitalised wages and salaries and purchases of materials for capital work.

In addition to obtaining the data, I have been researching additional papers related to my topic to determine my motivation and definitions of my thesis. I have found in excess of 40 papers and am still researching for additional papers. I am currently going through the papers that I have found to determine which are the most relevant to my topic. I will continue this activity over the coming 2 weeks. I have also received notification from the library that the Chambers text book I have requested is available for pick up and I will collect this today to continue my research into substitution elasticities.

Dr Poon has also provided me with four additional papers for me to read, however I had already come across most of them through my research. These papers are :

  • Fernadez, W., Gregor, S., Martin, M., Stern, S. & Vitale, Michael. ‘Identifying the Key Strategies in the Realization of Value from Information Technology’, 2007.
  • Fernandez, W. ,Gregor, S., Holtham, D,. Martin, M., Stern, S., Pratt, G. & Vitale, M., ‘Achieving Value from ICT: key management strategies’, Department of Communications, Information Technology and the Arts, ICT Research Study, Canberra, 2004.
  • Mittal, N. & Nault, B.R., ‘Investments in Information Technology: Indirect Effects and Information Technology Intensity’, Haskayne School of Business: University of Calgary Canada, 2006.
  • Dewan, S. 'The Subsitution of Information Technology for Other Factors of Production: A Firm Level Analysis', (2006) 43 Management Science 1660-16.
Dr. Poon for our next meeting would also like us to prepare a 15 minute presentation on a particular area that is inline with the research and literature reviewing that we are currently completing. My presentation will focus on the different testing methods of substitution elasticity that I have come across my research.

Our next meeting is scheduled to be early on in the first week of semester 2. My goals and aims I wish to achieve by the next meeting are:

  • Obtain a quote on the data to be obtain from the ABS
  • Continue to develop core skills using R
  • Continue further research int the testing methods of substitution of elasticity
  • Complete my thesis project plan

Tuesday, July 3, 2007

Paper Overview: “Is Information System Spending Productive? New Evidence and New Results”

This paper which was written by Brynjolfsson and Hitt (1993) was one of the background readings that Dr. Poon provided me with. I will provide very brief overview of the papers findings and models used and link it with the relevance to my project.

Model

The model used by Brynjolfsson and Hitt was quite simple, they imposed the following general form in relating the firms quantity of output produced to inputs used:

Where:
Q is the quantity of output
F is the production function
C is the computer capital input
K is non-capital input
S is information systems staff labour
L other labour and expenses
i is the specific firm
t is the time interval

They assumed that the production function conforms to the Cobb-Douglas specification

Where:
β1 is the output elasticity of
computer capital
β3 is the output elasticity of information systems staff labour

Since regression models need to be linear in the parameters a logarithmic transform is done to create the log-log linear model:

Where: Qit = output of a firm in industry i in year t
Cit = computer capital
Kit = non-computer capital
Sit = information systems staff labour capital
Lit = other labour and expenses
β is a vector of parameters to be estimated
Log denotes the natural logarithm
ε is a vector of random variables

Results

The Brynjolfsson and Hitt paper provided evidence for IT made a “substantial and statistically significant contribution to the output of firms”. This was in contrast to the evidence of previous papers which supported the notion of the “productivity paradox” existing that is that “despite enormous improvements in the underlying technology, the benefits of IS spending have not been found in aggregate output statistics”. Brynjolfsson and Hitt attributed the differences in the results owing to the following factors:

  • Measurement problems associated with the use of industry level and economic level data.
  • Data being used that had not incorporated the impact IT due to the lag effect and time needed for learning and adjustment
  • The intangible benefits that IT produces not being incorporated correctly into the estimated models

All of the fore mentioned issues would result in situation where one of the assumptions of classical linear regression model which that the regressors and disturbances are independent:

Where:
X is a regressor such as computer capital
ε is a disturbance term, random variable

When this fundamental assumption is violated it will result in biased, inefficient and inconsistent estimates of our parameters in our regression model and consequently the incorrect conclusions being drawn form the hypothesis tests.

Brynjolfsson and Hitt overcame the earlier listed problems by the following means:

  • Using firm level data which is more recent and incorporates the fact that firms have undertaken restructuring of their business process and are realising the benefits ofIT
  • Using iterated seemingly unrelated regression model (ISUR) to improve the efficiency of their estimates as it can directly address serial correlation (relationship between different firms in the same time period) and missing observations.
  • Using instrument variables to control for omitted variable bias and the violation of the assumption that regressors and the disturbances term are uncorrelated via three stage least squares (3SLS) estimation technique.

All of these procedures assist in overcoming the problems of producing biased, inconsistent and inefficient estimators which would result in the incorrect conclusion being drawn from our hypothesis. The problems of difficulties of measurement and aggregation errors being present in industry and economic data and the difficulties in capturing the effect of intangible variables are the most important aspects of the paper. Brynjolfsson and Hitt (1994) showed how these problems can ultimately result in the incorrect conclusions being drawn such as the productivity paradox. Additionally the provided guidance and techniques as to how these problems can be overcome. The techniques and problems presented in this paper has alerted me to the potential problems that I could encounter during my thesis but also potential solutions that I will be able to make use of.

Monday, July 2, 2007

Additional Readings

Dr. Poon also provided me with an additional reading and a text book reference for the AES. These are:
  • Lin, W.T. & Shao, B.B, 'The Business Value of Information Technology and inputs Substitution: The productivity paradox revisited', (2006) 42 Decision Support Systems 493-507.
  • Chambers R, Applied Production Analysis: A Dual Approach, ( New York : Cambridge University Press, 1988)
The book is currently on loan but I have requested it and it should be returned by the end of the week. In the mean time I will conduct my own research to gain a better understanding to AES. In the next few days I will provide more details as to the thesis scope, deliverables and overview of my progress.

All Systems are go!

On Friday the 29th of June I attended a thesis meeting with Dr. Poon and two of his other thesis students, Gary and Leslie. Dr. Poon had informed me that R was going to be used instead of E-views as the statistical software to be used for this project and the other two projects. After the conclusion of the meeting I downloaded and installed the latest version of R. Since I have no experience with this statistical software package, my additional goal for this week is to become familiar and competent with this tool. I have already found numerous tutorials on R and plan to complete a few of them to gain familiarity with R.

Project Plan

The meeting was extremely useful as we collectively came up with a broad project plan where we defined the particular thesis deliverables and goals we need to complete by the given date. The project plan can be seen below.

Over the coming weeks I will post up a more detailed project plan which will list the weekly milestones and deliverables I wish to achieve.

Additionally the meeting provided each of with greater clarity regarding the description and requirements of our project. In the sections below I have briefly outline the background to the problem and the specific sections which my project will be focusing on.

Problem Overview: Information Technology and Productivity

An extensive amount of literature has been written on the impact that information technology has on productivity. A measure of this impact can be represented by the following general mathematical representation:

where:
y is the output measured
IT are the input variables used to measure IT by
f is a specific productivity function applied to our input variables

Using this representation all the literature on information technology and its impact on productivity examines the following:

  • Is the relationship between IT and its impact on productivity significant
  • What are the specific factors that enhance this relationship

However a lot of the research into this area in particular during the 1980’s and early 90’s lead rise to a phenomenon called the productivity paradox. What the productivity paradox is that as information technology is introduces the productivity of a worker may actually decline as opposed to increasing.

The papers that I listed on my post on June the 7th provided numerous explanations and potential hypothesis as an explanation for this phenomenon. I will give an overview of these papers later on in the week.

The main problems from the examination of the relationship between IT and productivity stems from three main sources which are:

  • Finding a good quality measure of IT
  • Measurement issues regarding both output and input variables in terms of adjustments for factors such as inflation etc.
  • Issues regarding the measurement of complementary factors of IT


Finding a good quality measure of IT

IT can enhance the productivity of firm by two means. Firstly IT can be used as tool by acting as a substitute to manual labour and introducing automation. For instance, Brynjolfsson & Yang (1996) highlighted that, this particular use of IT is wide spread in the manufacturing sector where IT has automated a lot of processes such as ordering and has lead labour to become redundant in some instances. Secondly it can act as an enabler by adding value to a firms’ business process. For instance in the financial services industry (where I have experience in), I have observed that IT can add value to a business processes in various ways such as allowing profitable clients to be identified form their trading activities and thereby allowing more tailored client services to directed towards their needs.

The difficulty in finding a good quality of measure of IT is that whilst it is fairly easy to find data on IT acting as a tool it is more difficult to find data on IT as an enabler due the intangibility of it. Consequently if we do not capture this effect, our measurements of IT will be biased and this will flow through to our statistical tests and hypothesis interpretation.

Measurement issues regarding both output and input variables

Following on from the first problem is measurement issues in both output and input variable predominantly for the services industry. Brynjolfsson & Hitt (1993) listed the results of a survey which they conducted with managers that listed the five key rationales for investing into IT which are:

  • Labour savings
  • Better customer service
  • Faster response time
  • Greater product variety
  • Improved quality

The majority of this are intangible items are very difficult measure in terms of the impact it would have on overall output of a firm and as these cannot be measured and we would essentially be omitting them from our data set once again we would be faced with biased estimators and incorrect inferences being drawn from the hypothesis tests.

Furthermore the data used needs be adjusted for factors such as inflation etc. The majority of deflators that are available do not account for the improved quality, improved customer service etc. and by using this incorrect adjustment our data would once again be faced with the statistical problems that measurement error causes in analysis.


Issues regarding the measurement of complementary factors of IT

The complementary factors of IT (which are used in answering the question as to what are the factors that can enhance this relationship), pose significant problems in the analysis of the impact of IT on productivity. This is because these factors which add value to the organisation are intangible and are poorly measured if it all. Consequently the data that is aggregated excludes these items and we are potentially faced with the issue of an omitted variable bias. This is a serious statistical issue which violates on of the fundamental classical linear regression model assumptions, which is that the disturbances terms are independent of the regressors. If the omitted variable is correlated (in most cases it would be) with the input variables we have included, we once again will have biases estimates and incorrect conclusions drawn form our hypothesis tests.

Link between my thesis and the problem

My thesis will be employing the Organisation of Economic Cooperation and Development (OECD) definition of information technology. The OECD categorises IT into four distinct categories which are:

  • Hardware
  • Software
  • Communication
  • Services

Using data from the Australian Bureau of Statistics (ABS), measures are available for the first two that is hardware and software but not for the last two. Essentially what my thesis will aim to show whether an aggregation error exists and if hardware and software essentially add to the notation of a productivity paradox. Hence it will focus on showing how two of the four explanations provided by Brynjolfsson & Yang (1996): the existence of measurement error and lags due to learning and adjustment that It causes, contribute to the productivity paradox. To illustrate that software and hardware are not substitutes, that is not interchangeable for each other but complements, I will need to employ the Allen partial elasticity of Substitution (AES).

What needs to be done by the 9th of July

My next meeting held with Dr. Poon and my fellow colleagues will be a week from now, July 9th. Dr. Poon has entrusted us with finding more research papers that will give us further clarity in determining out thesis objectives and definitions. In addition to this I need to collect the data for my thesis from the ABS. The data will be take from the Economic Activity Survey, where I need to obtain the data for particular items of the survey. I will also aim to gain an understanding of AES and further my comprehension of the impact of input substitution on the productivity paradox.

Aims for next week:

  • Obtain further reading material
  • Start to learn and develop skills using R
  • Investigate AES

On Friday the 29th of June I attended a thesis meeting with Dr. Poon and two of his other thesis students, Gary and Leslie. Dr. Poon had informed me that R was going to be used instead of E-views as the statistical software to be used for this project and the other two projects. After the conclusion of the meeting I downloaded and installed the latest version of R. Since I have no experience with this statistical software package, my additional goal for this week is to become familiar and competent with this tool. I have already found numerous tutorials on R and plan to complete a few of them to gain familiarity with R.

Project Plan

The meeting was extremely useful as we collectively came up with a broad project plan where we defined the particular thesis deliverables and goals we need to complete by the given date. The project plan can be seen below. Over the coming weeks I will post up a more detailed project plan which will list the weekly milestones and deliverables I wish to achieve.

Additionally the meeting provided each of with greater clarity regarding the description and requirements of our project. In the sections below I have briefly outline the background to the problem and the specific sections which my project will be focusing on.

Problem Overview: Information Technology and Productivity

An extensive amount of literature has been written on the impact that information technology has on productivity. A measure of this impact can be represented by the following general mathematical representation:

where:
y is the output measured
IT are the input variables used to measure IT by
f is a specific productivity function applied to our input variables

Using this representation all the literature on information technology and its impact on productivity examines the following:

  1. Is the relationship between IT and its impact on productivity significant
  2. What are the specific factors that enhance this relationship

However a lot of the research into this area in particular during the 1980’s and early 90’s lead rise to a phenomenon called the productivity paradox. What the productivity paradox is that as information technology is introduces the productivity of a worker may actually decline as opposed to increasing.